Figure-1
| PolarSPARC |
Introduction to Docker Swarm (ARM Edition)
| Bhaskar S | 01/06/2019 |
Overview
Docker Swarm is a native clustering and orchestration solution from Docker that enables to bring together a bunch of machines (either physical or virtual) running Docker, to form a cluster such that the group of nodes appear to work together as a single virtual system. Once the cluster is formed, one can issue command to start a container and Docker Swarm will seemlessly orchestrate the request and schedule the container to run on any of the underlying node(s). As a result, this capability enables one scale, load balance, discovery, and provide high-availability for container services.
Note that we will be using the terms host(s), machine(s), and node(s) interchangeably. It is the entity running the Docker daemon.
The foundational element that enables this native cluster management in Docker Swarm is the overlay network. The overlay network driver is layered on top of the host network (also referred to as the underlay network) and creates a distributed network amongst the group of nodes running Docker.
In Introduction to Docker , we used the docker run commands to start a container application on a single node running Docker. This concept is abstracted to a higher level for Docker Swarm and is replaced by the docker service commands since we want multiple instances (replicas) of the container in the cluster. An instance of container running in Docker Swarm is referred to as a Task. It is the atomic scheduling unit for the cluster. A collection of task(s) forms a Service. A service can either be of type Replicated or Global.
For Replicated service(s), Docker Swarm schedules and distributes a specified number of task(s) (replicas) on the nodes of the cluster.
For Global service(s), Docker Swarm schedules one instance of a task on each node in the cluster.
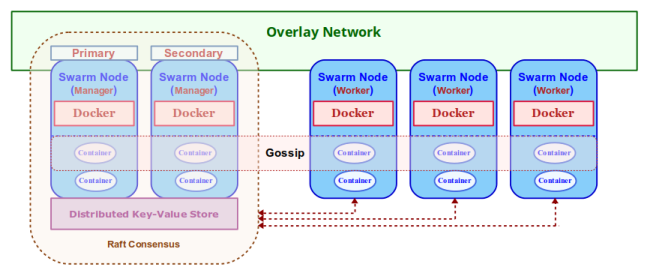
The following Figure-1 illustrates the high-level architectural overview of a Docker Swarm:
The core components that make Docker Swarm are as follows:
Swarm Node :: a node (running Docker) participating in the Docker Swarm cluster. There are two types of nodes - Manager node(s) and Worker node(s)
Swarm Manager :: node responsible for the management of the cluster as well as the orchestration and scheduling of service(s) on the nodes in the cluster. When a service is deployed to the cluster, the request is dispatched through this node
Raft Consensus :: there can be more than one instance of the Manager running in the cluster for fault-tolerance and high-availability. When there are multiple instances of Manager nodes, they use the Raft Consensus Algorithm to elect a leader (Primary Manager node) and the rest become the followers (Secondary Manager node(s))
Distributed Key-Value Store :: For consistency, the leader Manager node is responsible for maintaining the state of the cluster as well as the state of the service(s) and their running task(s). This state information is persisted in the internal distributed key-value store and shared with the follower Manager node(s). This distributed key-value store is also used for service discovery
Swarm Worker :: node that receives requests from the Manager node(s) to execute task(s) (i.e., run container(s)). By default, the Manager node(s) are also Worker node(s). The Worker node(s) periodically report back the status of the currently running task(s) as well as heartbeats (to indicate the health of the Worker node) back to the Primary Manager node
Gossip :: as service(s) are deployed across the Worker node(s) in the cluster, the Worker node(s) gossip (broadcast information) about the running service(s) with the other Worker node(s) in the cluster so each of the Worker node(s) are aware of where a particular service is running. This way when a service request comes to a node, the request can be intelligently routed to the appropriate node(s) even if that service is not running on the node receiving the request
Installation
The installation will be on a 5-node Raspberry Pi 3 Cluster running Linux.
The following Figure-2 illustrates the 5-node Raspberry Pi 3 cluster in operation:
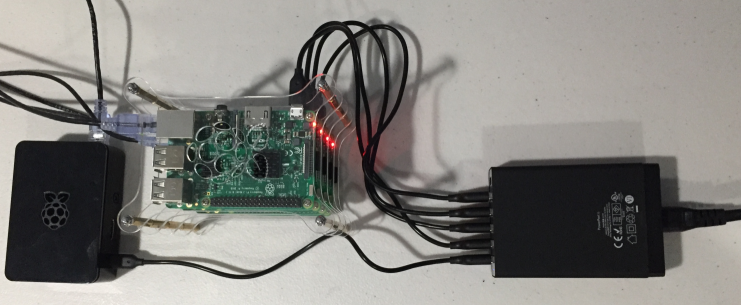
For this tutorial, let us assume the 5-nodes in the cluster to have the following host names and ip addresses:
| Host name | IP Address |
|---|---|
| my-node-1 | 192.168.1.201 |
| my-node-2 | 192.168.1.202 |
| my-node-3 | 192.168.1.203 |
| my-node-4 | 192.168.1.204 |
| my-node-5 | 192.168.1.205 |
Open a Terminal window and open a tab for each of the 5 nodes my-node-1 thru my-node-5. In each of the Terminal tabs, ssh into the corresponding node.
To install the Docker on each of the nodes my-node-<N>, where <N> ranges from 1 thru 5, execute the following commands:
$ curl -fsSL https://get.docker.com -o get-docker.sh
$ sudo sh get-docker.sh
$ sudo usermod -aG docker $USER
$ sudo shutdown -r now
Once reboot completes, execute the following command to check everything was ok:
$ docker info
The following would be a typical output:
Containers: 0
 Running: 0
 Paused: 0
 Stopped: 0
Images: 0
Server Version: 18.09.0
Storage Driver: overlay2
 Backing Filesystem: extfs
 Supports d_type: true
 Native Overlay Diff: true
Logging Driver: json-file
Cgroup Driver: cgroupfs
Plugins:
 Volume: local
 Network: bridge host macvlan null overlay
 Log: awslogs fluentd gcplogs gelf journald json-file local logentries splunk syslog
Swarm: inactive
Runtimes: runc
Default Runtime: runc
Init Binary: docker-init
containerd version: c4446665cb9c30056f4998ed953e6d4ff22c7c39
runc version: 4fc53a81fb7c994640722ac585fa9ca548971871
init version: fec3683
Security Options:
 seccomp
  Profile: default
Kernel Version: 4.14.79-v7+
Operating System: Raspbian GNU/Linux 9 (stretch)
OSType: linux
Architecture: armv7l
CPUs: 4
Total Memory: 927.2MiB
Name: my-node-2
ID: KJPD:V6VV:7Z7A:3GCU:DJ5Z:2WYO:4HUH:TT56:RO4N:DTXI:JHHY:UJXL
Docker Root Dir: /var/lib/docker
Debug Mode (client): false
Debug Mode (server): false
Registry: https://index.docker.io/v1/
Labels:
Experimental: false
Insecure Registries:
 127.0.0.0/8
Live Restore Enabled: false
Product License: Community Engine

WARNING: No memory limit support
WARNING: No swap limit support
WARNING: No kernel memory limit support
WARNING: No oom kill disable support
WARNING: No cpu cfs quota support
WARNING: No cpu cfs period support
Hands-on with Docker Swarm
For starters, we will make the node my-node-1 the Manager node. Initializing Docker Swarm on a node will by default make it the Manager node. To do that, execute the following command:
$ docker swarm init
The following would be a typical output:
Swarm initialized: current node (yhlsk4xkisyt4sudja739tein) is now a manager.

To add a worker to this swarm, run the following command:

    docker swarm join --token SWMTKN-1-05371dg4yidjg9cyjj9bqmksrvbwr2aemjkzktzs9bb32m6696-1xnlvxjiy5uzp9ve23qzg0nl2 192.168.1.201:2377

To add a manager to this swarm, run 'docker swarm join-token manager' and follow the instructions.
To list all the node(s) in Docker Swarm cluster, execute the following command on my-node-1:
$ docker node ls
The following would be a typical output:
ID                            HOSTNAME    STATUS   AVAILABILITY   MANAGER STATUS   ENGINE VERSION
yhlsk4xkisyt4sudja739tein *   my-node-1   Ready    Active         Leader           18.09.0
Since there is only one Manager node, that will be the leader by default. This is evident from the Output.3 above.
To get the command to join the Docker Swarm as a Worker node, execute the following command on my-node-1:
$ docker swarm join-token worker
The following would be a typical output:
To add a worker to this swarm, run the following command:

    docker swarm join --token SWMTKN-1-05371dg4yidjg9cyjj9bqmksrvbwr2aemjkzktzs9bb32m6696-1xnlvxjiy5uzp9ve23qzg0nl2 192.168.1.201:2377
For this tutorial, we desire that nodes my-node-2 thru my-node-5 be the Worker nodes of the Docker Swarm cluster. For each of the nodes my-node-2 thru my-node-5 (in their respective Terminal tabs), execute the following command:
$ docker swarm join --token SWMTKN-1-05371dg4yidjg9cyjj9bqmksrvbwr2aemjkzktzs9bb32m6696-1xnlvxjiy5uzp9ve23qzg0nl2 192.168.1.201:2377
The following would be a typical output:
This node joined a swarm as a worker.
To list all the active nodes in the Docker Swarm cluster, execute the following command on my-node-1:
$ docker node ls
The following would be a typical output:
ID                            HOSTNAME     STATUS    AVAILABILITY    MANAGER STATUS    ENGINE VERSION
yhlsk4xkisyt4sudja739tein *   my-node-1    Ready     Active          Leader            18.09.0
ysfdsa90av9sozuf1mj423o52     my-node-2    Ready     Active                            18.09.0
8t9gi8r6gzcb2g1e5lrgo68xp     my-node-3    Ready     Active                            18.09.0
mgg6zgj4ps6exjazinjqek34b     my-node-4    Ready     Active                            18.09.0
g64llfie3pocofy7h1ytftb4o     my-node-5    Ready     Active                            18.09.0
If we try to list all the active nodes in the Docker Swarm cluster from my-node-2, the following would be a typical output:
Error response from daemon: This node is not a swarm manager. Worker nodes can't be used to view or modify cluster state. Please run this command on a manager node or promote the current node to a manager.
To list the Manager node(s), execute the following command on my-node-1:
$ docker node ls --filter role=manager
The following would be a typical output:
ID                            HOSTNAME    STATUS   AVAILABILITY   MANAGER STATUS   ENGINE VERSION
yhlsk4xkisyt4sudja739tein *   my-node-1   Ready    Active         Leader           18.09.0
Similarly, to list the Worker node(s), execute the following command on my-node-1:
$ docker node ls --filter role=worker
The following would be a typical output:
ID                           HOSTNAME     STATUS    AVAILABILITY    MANAGER STATUS    ENGINE VERSION
ysfdsa90av9sozuf1mj423o52    my-node-2    Ready     Active                            18.09.0
8t9gi8r6gzcb2g1e5lrgo68xp    my-node-3    Ready     Active                            18.09.0
mgg6zgj4ps6exjazinjqek34b    my-node-4    Ready     Active                            18.09.0
g64llfie3pocofy7h1ytftb4o    my-node-5    Ready     Active                            18.09.0
To promote the Worker node my-node-2 to a Manager node, execute the following command on my-node-1:
$ docker node promote my-node-2
The following would be a typical output:
Node my-node-2 promoted to a manager in the swarm.
Once again, we will list all the Manager node(s) by executing the following command on my-node-1:
$ docker node ls --filter role=manager
The following would be a typical output:
ID                            HOSTNAME     STATUS    AVAILABILITY    MANAGER STATUS    ENGINE VERSION
yhlsk4xkisyt4sudja739tein *   my-node-1    Ready     Active          Leader            18.09.0
ysfdsa90av9sozuf1mj423o52     my-node-2    Ready     Active          Reachable         18.09.0
To demote the Manager node my-node-2 back to a Worker node, execute the following command on my-node-1:
$ docker node demote my-node-2
The following would be a typical output:
Manager my-node-2 demoted in the swarm.
Once again, we will list all the Manager node(s) by executing the following command on my-node-1:
$ docker node ls --filter role=manager
The output would look like the one from Output.8 from above.
To display detailed information about any node (say my-node-2) in the Docker Swarm cluster, execute the following command on my-node-1:
$ docker node inspect my-node-2
The following would be a typical output:
[
    {
        "ID": "ysfdsa90av9sozuf1mj423o52",
        "Version": {
            "Index": 145
        },
        "CreatedAt": "2019-01-02T19:11:42.150399955Z",
        "UpdatedAt": "2019-01-06T01:54:48.989432852Z",
        "Spec": {
            "Labels": {},
            "Role": "worker",
            "Availability": "active"
        },
        "Description": {
            "Hostname": "my-node-2",
            "Platform": {
                "Architecture": "armv7l",
                "OS": "linux"
            },
            "Resources": {
                "NanoCPUs": 4000000000,
                "MemoryBytes": 972234752
            },
            "Engine": {
                "EngineVersion": "18.09.0",
                "Plugins": [
                    {
                        "Type": "Log",
                        "Name": "awslogs"
                    },
                    {
                        "Type": "Log",
                        "Name": "fluentd"
                    },
                    {
                        "Type": "Log",
                        "Name": "gcplogs"
                    },
                    {
                        "Type": "Log",
                        "Name": "gelf"
                    },
                    {
                        "Type": "Log",
                        "Name": "journald"
                    },
                    {
                        "Type": "Log",
                        "Name": "json-file"
                    },
                    {
                        "Type": "Log",
                        "Name": "local"
                    },
                    {
                        "Type": "Log",
                        "Name": "logentries"
                    },
                    {
                        "Type": "Log",
                        "Name": "splunk"
                    },
                    {
                        "Type": "Log",
                        "Name": "syslog"
                    },
                    {
                        "Type": "Network",
                        "Name": "bridge"
                    },
                    {
                        "Type": "Network",
                        "Name": "host"
                    },
                    {
                        "Type": "Network",
                        "Name": "macvlan"
                    },
                    {
                        "Type": "Network",
                        "Name": "null"
                    },
                    {
                        "Type": "Network",
                        "Name": "overlay"
                    },
                    {
                        "Type": "Volume",
                        "Name": "local"
                    }
                ]
            },
            "TLSInfo": {
                "TrustRoot": "-----BEGIN CERTIFICATE-----\nMIIBajCCARCgAwIBAgIUb7m/OcUlnVeBiIrroSThv6W8GWowCgYIKoZIzj0EAwIw\nEzERMA8GA1UEAxMIc3dhcm0tY2EwHhcNMTkwMTAyMTkwNDAwWhcNMzgxMjI4MTkw\nNDAwWjATMREwDwYDVQQDEwhzd2FybS1jYTBZMBMGByqGSM49AgEGCCqGSM49AwEH\nA0IABE5vxnpPo4OqupArcKvhn0yN9iqERNczIMFCiujOCSXlAjqM1v4cGA21onyi\nLbdklIAZfKvDKO7HTNigVl3Xi8ujQjBAMA4GA1UdDwEB/wQEAwIBBjAPBgNVHRMB\nAf8EBTADAQH/MB0GA1UdDgQWBBRgMI2Gr5zXFQaO01dpC8VTa3wNfzAKBggqhkjO\nPQQDAgNIADBFAiAApSSrnxxAVjrGW8FTQJ4Svnf5YUmMos6wOKhTCec6uwIhAPLi\nW8KdkPHzdXzLIhmEZbu2op72XsBkvy+LB5OzK6PO\n-----END CERTIFICATE-----\n",
                "CertIssuerSubject": "MBMxETAPBgNVBAMTCHN3YXJtLWNh",
                "CertIssuerPublicKey": "MFkwEwYHKoZIzj0CAQYIKoZIzj0DAQcDQgAETm/Gek+jg6q6kCtwq+GfTI32KoRE1zMgwUKK6M4JJeUCOozW/hwYDbWifKItt2SUgBl8q8Mo7sdM2KBWXdeLyw=="
            }
        },
        "Status": {
            "State": "ready",
            "Addr": "192.168.1.202"
        }
    }
]
One can attach custom metadata to any node in the Docker Swarm cluster in the form of label(s). A label can be just a key (basically a string) or a key-value pair.
For our example, let us add a key label of dev to nodes my-node-2 , my-node-3 and a key label of prod to nodes my-node-4, my-node-5. Also, we will add a key-value label of dc=nj to nodes my-node-2, my-node-4 and a key-value label of dc=ca to nodes my-node-3, my-node-5.
To add the custom labels to our nodes in the Docker Swarm cluster, execute the following commands on my-node-1:
$ docker node update --label-add dev --label-add dc=nj my-node-2
$ docker node update --label-add dev --label-add dc=ca my-node-3
$ docker node update --label-add prod --label-add dc=nj my-node-4
$ docker node update --label-add prod --label-add dc=ca my-node-5
Now, moving on to service(s) in the Docker Swarm cluster.
To list all the service(s) in Docker Swarm cluster, execute the following command on my-node-1:
$ docker service ls
The following would be a typical output:
ID NAME MODE REPLICAS IMAGE PORTS
To start 3 replicas of the official tomcat Docker image in the Docker Swarm cluster, execute the following command on my-node-1:
docker service create --name tomcat --replicas=3 --publish 8080:8080 tomcat:8.0
The following would be a typical output:
c5z946stm58h8298zegk2qimw
overall progress: 0 out of 3 tasks
1/3: running   [==================================================>]
2/3: running   [==================================================>]
3/3: running   [==================================================>]
verify: Service converged
When a docker service create command is issued on a Docker Swarm cluster, the Manager node accepts the request and schedules the execution of the requested Docker image (tomcat:8.0) as a task on the requested number of Worker nodes (replicas). In this example, we have requested 3 replicas of the tomcat:8.0 image. Once the requested number of container instances (replicas) are live, the service is in the desired state and converged.
To list all the service(s) in Docker Swarm cluster, execute the following command on my-node-1:
$ docker service ls
The following would be a typical output:
ID              NAME      MODE          REPLICAS    IMAGE         PORTS
c5z946stm58h    tomcat    replicated    3/3         tomcat:8.0    *:8080->8080/tcp
From the Output.12 above, we see that the service if of type replicated, all the 3 replicas are alive (3/3), the image is tomcat:8.0, and the port 8080 in the host is mapped to the port 8080 on the running container.
To display all the logs for the service (from all the replicas) in Docker Swarm cluster, execute the following command on my-node-1:
$ docker service logs tomcat
The following would be a typical output:
tomcat.3.qv76q9vo6fk0@my-node-1    | 02-Jan-2019 19:38:32.384 INFO [main] org.apache.catalina.startup.VersionLoggerListener.log Server version:        Apache Tomcat/8.0.53
tomcat.3.qv76q9vo6fk0@my-node-1    | 02-Jan-2019 19:38:32.395 INFO [main] org.apache.catalina.startup.VersionLoggerListener.log Server built:          Jun 29 2018 14:42:45 UTC
.
[truncated]
.
tomcat.3.qv76q9vo6fk0@my-node-1    | 02-Jan-2019 19:38:32.412 INFO [main] org.apache.catalina.startup.VersionLoggerListener.log Command line argument: -Djava.io.tmpdir=/usr/local/tomcat/temp
tomcat.1.zq83exm1ctfd@my-node-2    | 02-Jan-2019 19:38:37.866 INFO [main] org.apache.catalina.startup.VersionLoggerListener.log Server version:        Apache Tomcat/8.0.53
tomcat.1.zq83exm1ctfd@my-node-2    | 02-Jan-2019 19:38:37.877 INFO [main] org.apache.catalina.startup.VersionLoggerListener.log Server built:          Jun 29 2018 14:42:45 UTC
.
[truncated]
.
tomcat.3.qv76q9vo6fk0@my-node-1    | 02-Jan-2019 19:38:47.902 INFO [main] org.apache.coyote.AbstractProtocol.start Starting ProtocolHandler ["http-apr-8080"]
tomcat.3.qv76q9vo6fk0@my-node-1    | 02-Jan-2019 19:38:47.992 INFO [main] org.apache.coyote.AbstractProtocol.start Starting ProtocolHandler ["ajp-apr-8009"]
tomcat.3.qv76q9vo6fk0@my-node-1    | 02-Jan-2019 19:38:47.999 INFO [main] org.apache.catalina.startup.Catalina.start Server startup in 14567 ms
.
[truncated]
.
tomcat.2.b7rzzky92d1q@my-node-3    | 02-Jan-2019 19:38:31.123 INFO [main] org.apache.catalina.startup.VersionLoggerListener.log Server version:        Apache Tomcat/8.0.53
tomcat.2.b7rzzky92d1q@my-node-3    | 02-Jan-2019 19:38:31.133 INFO [main] org.apache.catalina.startup.VersionLoggerListener.log Server built:          Jun 29 2018 14:42:45 UTC
.
[truncated]
.
tomcat.2.b7rzzky92d1q@my-node-3    | 02-Jan-2019 19:38:32.134 INFO [main] org.apache.catalina.startup.Catalina.load Initialization processed in 5816 ms
tomcat.2.b7rzzky92d1q@my-node-3    | 02-Jan-2019 19:38:32.383 INFO [main] org.apache.catalina.core.StandardService.startInternal Starting service Catalina
tomcat.1.zq83exm1ctfd@my-node-2    | 02-Jan-2019 19:38:53.240 INFO [main] org.apache.coyote.AbstractProtocol.start Starting ProtocolHandler ["http-apr-8080"]
tomcat.2.b7rzzky92d1q@my-node-3    | 02-Jan-2019 19:38:32.384 INFO [main] org.apache.catalina.core.StandardEngine.startInternal Starting Servlet Engine: Apache Tomcat/8.0.53
tomcat.1.zq83exm1ctfd@my-node-2    | 02-Jan-2019 19:38:53.331 INFO [main] org.apache.coyote.AbstractProtocol.start Starting ProtocolHandler ["ajp-apr-8009"]
tomcat.2.b7rzzky92d1q@my-node-3    | 02-Jan-2019 19:38:32.443 INFO [localhost-startStop-1] org.apache.catalina.startup.HostConfig.deployDirectory Deploying web application directory /usr/local/tomcat/webapps/docs
tomcat.2.b7rzzky92d1q@my-node-3    | 02-Jan-2019 19:38:38.094 INFO [localhost-startStop-1] org.apache.catalina.startup.HostConfig.deployDirectory Deployment of web application directory /usr/local/tomcat/webapps/docs has finished in 5,648 ms
tomcat.2.b7rzzky92d1q@my-node-3    | 02-Jan-2019 19:38:38.096 INFO [localhost-startStop-1] org.apache.catalina.startup.HostConfig.deployDirectory Deploying web application directory /usr/local/tomcat/webapps/host-manager
tomcat.2.b7rzzky92d1q@my-node-3    | 02-Jan-2019 19:38:46.421 INFO [localhost-startStop-1] org.apache.catalina.startup.HostConfig.deployDirectory Deployment of web application directory /usr/local/tomcat/webapps/manager has finished in 888 ms
tomcat.2.b7rzzky92d1q@my-node-3    | 02-Jan-2019 19:38:46.447 INFO [main] org.apache.coyote.AbstractProtocol.start Starting ProtocolHandler ["http-apr-8080"]
tomcat.2.b7rzzky92d1q@my-node-3    | 02-Jan-2019 19:38:46.537 INFO [main] org.apache.coyote.AbstractProtocol.start Starting ProtocolHandler ["ajp-apr-8009"]
tomcat.2.b7rzzky92d1q@my-node-3    | 02-Jan-2019 19:38:46.544 INFO [main] org.apache.catalina.startup.Catalina.start Server startup in 14409 ms
tomcat.1.zq83exm1ctfd@my-node-2    | 02-Jan-2019 19:38:53.338 INFO [main] org.apache.catalina.startup.Catalina.start Server startup in 14451 ms
Note that we have [truncated] the log lines in between for brevity.
To list the nodes on which the service (tomcat) is running on Docker Swarm cluster, execute the following command on my-node-1:
$ docker service ps tomcat
The following would be a typical output:
ID              NAME        IMAGE         NODE         DESIRED STATE    CURRENT STATE            ERROR   PORTS
0q9d12ib1gaf    tomcat.1    tomcat:8.0    my-node-1    Running          Running 34 seconds ago
48ii5gsqye1t    tomcat.2    tomcat:8.0    my-node-2    Running          Running 34 seconds ago
srg0pnta9s32    tomcat.3    tomcat:8.0    my-node-3    Running          Running 34 seconds ago
To see what containers are running on my-node-1, execute the following command:
$ docker ps
The following would be a typical output:
CONTAINER ID    IMAGE         COMMAND             CREATED              STATUS              PORTS       NAMES
11b74807d3d0    tomcat:8.0    "catalina.sh run"   About a minute ago   Up About a minute   8080/tcp    tomcat.3.qv76q9vo6fk02v47nqk3ftflo
Similarly, to see what containers are running on my-node-2, execute the following command:
$ docker ps
The following would be a typical output:
CONTAINER ID    IMAGE         COMMAND             CREATED           STATUS           PORTS       NAMES
7d18eb6bee88    tomcat:8.0    "catalina.sh run"   53 seconds ago    Up 50 seconds    8080/tcp    tomcat.1.zq83exm1ctfdvsplpme3uwzpt
Similarly, to see what containers are running on my-node-3, execute the following command:
$ docker ps
The following would be a typical output:
CONTAINER ID    IMAGE         COMMAND             CREATED              STATUS              PORTS       NAMES
a0485f284734    tomcat:8.0    "catalina.sh run"   About a minute ago   Up About a minute   8080/tcp    tomcat.2.b7rzzky92d1qw2smhe4qeuovi
To inspect the service (tomcat), execute the following command on my-node-1:
$ docker service inspect tomcat
The following would be a typical output:
[
    {
        "ID": "so8f76wrku82gfb7zaehpvg0j",
        "Version": {
            "Index": 79
        },
        "CreatedAt": "2019-01-06T00:58:27.603487831Z",
        "UpdatedAt": "2019-01-06T00:58:27.608545638Z",
        "Spec": {
            "Name": "tomcat",
            "Labels": {},
            "TaskTemplate": {
                "ContainerSpec": {
                    "Image": "tomcat:8.0@sha256:8ecb10948deb32c34aeadf7bf95d12a93fbd3527911fa629c1a3e7823b89ce6f",
                    "Init": false,
                    "StopGracePeriod": 10000000000,
                    "DNSConfig": {},
                    "Isolation": "default"
                },
                "Resources": {
                    "Limits": {},
                    "Reservations": {}
                },
                "RestartPolicy": {
                    "Condition": "any",
                    "Delay": 5000000000,
                    "MaxAttempts": 0
                },
                "Placement": {
                    "Platforms": [
                        {
                            "Architecture": "amd64",
                            "OS": "linux"
                        },
                        {
                            "OS": "linux"
                        },
                        {
                            "OS": "linux"
                        },
                        {
                            "Architecture": "386",
                            "OS": "linux"
                        }
                    ]
                },
                "ForceUpdate": 0,
                "Runtime": "container"
            },
            "Mode": {
                "Replicated": {
                    "Replicas": 3
                }
            },
            "UpdateConfig": {
                "Parallelism": 1,
                "FailureAction": "pause",
                "Monitor": 5000000000,
                "MaxFailureRatio": 0,
                "Order": "stop-first"
            },
            "RollbackConfig": {
                "Parallelism": 1,
                "FailureAction": "pause",
                "Monitor": 5000000000,
                "MaxFailureRatio": 0,
                "Order": "stop-first"
            },
            "EndpointSpec": {
                "Mode": "vip",
                "Ports": [
                    {
                        "Protocol": "tcp",
                        "TargetPort": 8080,
                        "PublishedPort": 8080,
                        "PublishMode": "ingress"
                    }
                ]
            }
        },
        "Endpoint": {
            "Spec": {
                "Mode": "vip",
                "Ports": [
                    {
                        "Protocol": "tcp",
                        "TargetPort": 8080,
                        "PublishedPort": 8080,
                        "PublishMode": "ingress"
                    }
                ]
            },
            "Ports": [
                {
                    "Protocol": "tcp",
                    "TargetPort": 8080,
                    "PublishedPort": 8080,
                    "PublishMode": "ingress"
                }
            ],
            "VirtualIPs": [
                {
                    "NetworkID": "i2ebnurghtq5qsw0pshuh51c7",
                    "Addr": "10.255.0.7/16"
                }
            ]
        }
    }
]
To scale down the number of service (tomcat) replicas to 2 from the current 3 replicas, execute the following command on my-node-1:
$ docker service scale tomcat=2
The following would be a typical output:
tomcat scaled to 2
overall progress: 2 out of 2 tasks
1/2: running   [==================================================>]
2/2: running   [==================================================>]
verify: Service converged
To list all the service(s) in Docker Swarm cluster, execute the following command on my-node-1:
$ docker service ls
The following would be a typical output:
ID              NAME        IMAGE         NODE         DESIRED STATE    CURRENT STATE            ERROR    PORTS
0q9d12ib1gaf    tomcat.1    tomcat:8.0    my-node-1    Running          Running 11 minutes ago
48ii5gsqye1t    tomcat.2    tomcat:8.0    my-node-2    Running          Running 11 minutes ago
From the above, it is evident that there are no container tasks(s) running on the Worker node my-node-3.
Open up a browser and hit the url http://192.168.1.203:8080.
The following Figure-3 illustrates the browser output:
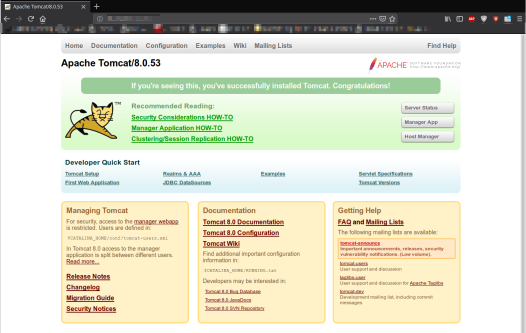
WHAT ??? How did that work ??? There was no container tasks(s) running on the Worker node my-node-3.
Remember we touched on the Distributed Key-Value Store as well as the Gossip amongst the Worker nodes in the overview ???
So, when node my-node-3 got the HTTP request, it intelligently routed the request to the node running the service (tomcat). The ingress network makes the published ports available on every node in the Docker Swarm cluster. When a request is made on a node, Docker Swarm will route the request to the node running the service (tomcat) through the overlay network (ingress).
Now, moving on to network(s) in the Docker Swarm cluster.
To list all the network(s) in Docker Swarm cluster, execute the following command on my-node-1:
$ docker network ls
The following would be a typical output:
NETWORK ID          NAME                DRIVER              SCOPE
e383b4100666        bridge              bridge              local
d03b0dbb69c0        docker_gwbridge     bridge              local
9f2d5ef59b2d        host                host                local
i2ebnurghtq5        ingress             overlay             swarm
cc18c34e7a4e        none                null                local
Remember we talked about the overlay network above in the overview ???
When the Docker Swarm cluster is first initialized using docker swarm init, that is when the default overlay network called ingress is created and the node automatically joins that network. As the other Worker nodes join the Docker Swarm cluster, they also join the ingress network.
To list all the network(s) in my-node-2, execute the following command:
$ docker network ls
The following would be a typical output:
NETWORK ID          NAME                DRIVER              SCOPE
2151da181d06        bridge              bridge              local
03c0495397ed        docker_gwbridge     bridge              local
d3d5f3be063f        host                host                local
i2ebnurghtq5        ingress             overlay             swarm
332144c96eda        none                null                local
Similarly, to list all the network(s) in my-node-3, execute the following command:
$ docker network ls
The following would be a typical output:
NETWORK ID          NAME                DRIVER              SCOPE
5568c2945bc2        bridge              bridge              local
8bf7677ad5e0        docker_gwbridge     bridge              local
2dcc510fc72d        host                host                local
i2ebnurghtq5        ingress             overlay             swarm
df884c822e70        none                null                local
As is evident from the Output.21, Output.22, and Output.23, the ingress network is the same across the Docker Swarm nodes, while the other networks are different as they are local to the nodes.
To remove all the replicas of the service (tomcat), execute the following command on my-node-1:
$ docker service rm tomcat
The following would be a typical output:
tomcat
To list all the service(s) in Docker Swarm cluster, execute the following command on my-node-1:
$ docker service ls
The following would be a typical output:
ID NAME MODE REPLICAS IMAGE PORTS
We can control on which nodes of the Docker Swarm cluster we want a particular service to run. For example, we can constraint the tomcat service to start only on the nodes with the label dc=nj (remember we added this label only to nodes my-node-2 and my-node-4).
To start a replica of the tomcat service on any node of the Docker Swarm cluster with the label dc=nj, execute the following command on my-node-1:
docker service create --constraint node.labels.dev --name tomcat --publish 8080:8080 tomcat:8.0
The following would be a typical output:
yx1v7cvv4t88f2dlnpxeia1ux
overall progress: 1 out of 1 tasks
1/1: running   [==================================================>]
verify: Service converged
To verify the node on which the service (tomcat) is running on Docker Swarm cluster, execute the following command on my-node-1:
$ docker service ps tomcat
The following would be a typical output:
ID              NAME        IMAGE         NODE         DESIRED STATE    CURRENT STATE             ERROR    PORTS
1k2olon0ihdg    tomcat.1    tomcat:8.0    my-node-2    Running          Running 22 seconds ago
BINGO !!! As we can see from Output.31, tomcat is running on my-node-2.
With this, we conclude the basic exercises we performed on the Docker Swarm cluster.
References